Appearance
consul-adapter部署
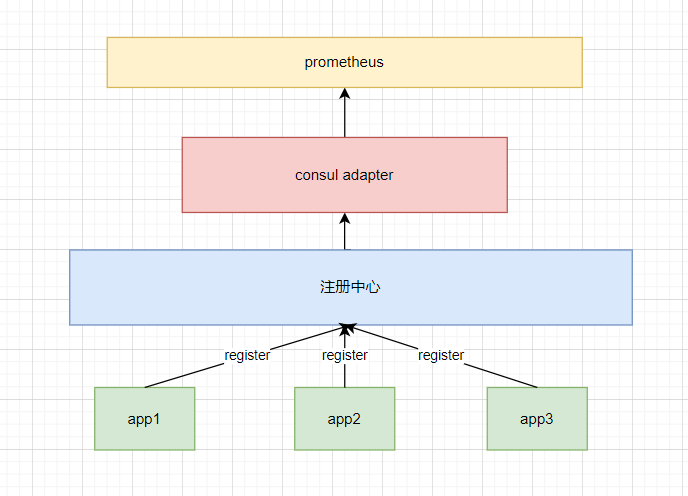
consul-adapter是从注册中心拉取微服务的实例等信息,能够使prometheus自动发现注册中心中的服务。
1.1.consul-adapter安装
1.1.1.获取consul-adapter-xxx.zip的安装包
1.1.2.上传安装包至~/app-run安装目录下执行如下命令:
shell
unzip consul-adapter-xxx.zip1.1.3.配置修改
只需修改注册中心地址即可;如何是使用的 nacos 注册中心,注意修改分组名和命名空间的名称,只有相同命名空间下的微服务才能被 consul-adapter 获取到。
application.yml中配置通知相关参数:
yaml
spring:
  application:
    name: consul-adapter
  cloud:
    nacos:
      discovery:
        enabled: false
        server-addr: 192.168.164.179:8848
        group: DEFAULT_GROUP
        metadata:
          management:
            #更改actuator路径后,该目录也需要修改
            context-path: /lhdmon
server:
  port: 18848
  servlet:
    context-path: /
eureka:
  instance:
    hostname: ${hostname:localhost}
    prefer-ip-address: true
    lease-expiration-duration-in-seconds: 15 #服务过期时间
    lease-renewal-interval-in-seconds: 5 #服务刷新时间,每5s心跳一次
    health-check-url-path: /lhdmon/health
    status-page-url-path: /lhdmon/info
    metadata-map:
      management:
        context-path: /lhdmon
  client:
    enabled: true
    register-with-eureka: true
    fetch-registry: true
    prefer-same-zone-eureka: true
    service-url:
      defaultZone: http://192.168.164.180:9527/eureka
    healthcheck:
      enabled: true
    eurekaServiceUrlPollIntervalSeconds: 60
    registry-fetch-interval-seconds: 5
adapter:
  service:
    filterSwitch: false #针对全行级统一注册中心可配置adapter是否开启获取服务列表配置
    serviceList: ENSEMBLE-CIF-SERVICE,APOLLO-PORTAL #开启后,只拉去serviceList中配置的服务列表
management:
  server:
  endpoints:
    web:
      base-path: /lhdmon
      exposure:
        include: "*"
  endpoint:
    health:
      show-details: ALWAYS
  metrics:
    tags:
application: consul-adapter1.1.4.启动
进入unify-alert的bin目录下,执行如下命令:
shell
./start.sh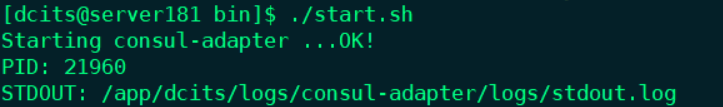
1.1.5.检查服务
执行如下命令:
shell
jps -lm | grep ConsulAdapterApplication
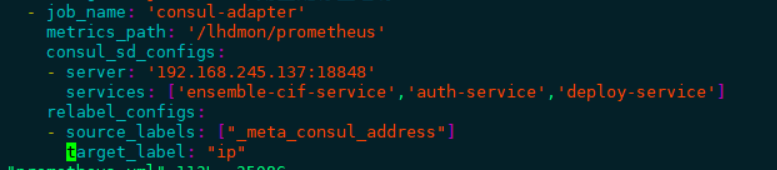
1.2.Prometheus中配置consul-adapter
在prometheus服务的prometheus.yml文件中配置consul-adapter的地址,拉去注册中心上所有微服务的监控数据。
yaml
  - job_name: 'consul-adapter'
    metrics_path: '/lhdmon/prometheus'
    consul_sd_configs:
      - server: '192.168.245.137:18848'
        services: [ 'ensemble-cif-service','auth-service','deploy-service' ] #可配置筛选服务名
    relabel_configs:
      - source_labels: [ "_meta_consul_address" ]
        target_label: "ip"